One too many Wasted Sunsets, One too many for the road
Good news – it’s summer!
The sun is warm, the BBQ’s have been fired into action and schools are officially out for summer. Well, in our household anyway as we leave behind GCSE season, and are just a hop, skip and a jump away from skipping some of those school holiday queues, shedding what feels like months and months of abstinence from both fun and enjoyment by jumping on a plane for a Swiss mountain adventure and a couple of games supporting the Lionesses at the Euros.
Whilst the revellers at Glastonbury this year have enjoyed the sun-baked fields of Somerset, when it was my time to enjoy ‘the GCSE summer’, all the way back in the early 1990’s it was unseasonally wet and soggy. Looking through some of the economic data today, there is a certain sogginess underfoot too in the jobs data, growth outlook and inflation numbers. These will all need keeping a close eye on to make sure that sogginess does not turn into a true ‘Glasto’ mudfest, at least more attention than equity markets are paying anyway, as the FTSE 100 hits all time high’s…
Throw into the mix heightened geopolitical risk and uncertainty and there continues to be plenty of challenges out there that are likely to restrain markets moving that far forward from here. As we settle into some summer holiday reading, we will also be spending plenty of time thinking about these questions:
1) What is the potential economic pattern we are expecting to see in the coming quarter or two?
Turning to the potential pattern ahead for the next quarter or two. To our mind, the coming quarters are likely to be one of slow and slowing growth. Tariffs have muddied the water as consumers and companies dragged forward demand to earlier this year to mitigate some of the tariff impact. There is a risk this gives an illusion of a more solid economic backdrop in comparison to what we are likely to step into during the second half of the year. This slow and sluggish economic growth will bring with it rising stresses in the jobs market, which in turn, triggers a more cautious consumer and lower spending. With tariff impacts emerging in the US, this helps keep consumer prices higher than would have otherwise been the case and weakening growth is unlikely to spur the Federal Reserve into rate cutting action until the very end of this year. In the UK, the steady as she goes, once a quarter rate cuts are likely to continue, whilst the ECB, no longer concerned with the inflation picture is probably closer to the end of its own rate-cutting policy than peers.
2) What should we be thinking about that could potentially change our thinking or portfolio positioning?
Watchlist 1: Jobs
Jobs remain a key metric to be looking out for. Why? Well for central bankers, whilst inflation is a bugbear, the causes for elevated UK inflation at least can be identified and are not perceived as long-term drivers – these are things like annual rises in energy bills, car tax and so on, but also national insurance and national living wage rises which are pushing through wage cost increases.
Important too because in developed economies, such as the US & the UK, roughly 2/3rds of our economies are driven by consumer spending, so fewer people in work means fewer people out spending on goods, leisure and ‘stuff’.
Whilst there are question marks about the reliability and volatility of jobs data, there are broad signs of weakness which should be watched. These are:
- The unemployment rate which is slowly moving upwards. After Covid, there was an element of labour hoarding, but the unemployment rate has now been drifting higher since 2022 and recent jobs reports have been weak. In the United States, hiring has slowed to its slowest pace for two years. In the latest Federal Reserve Beige Book – an economic snapshot of the US economy – it highlighted uncertainty that was preventing hiring, lowering labour demand and resulting in declining hours being worked.
- The employment rate is in decline – it has now fallen 9 out of the last 10 months here in the UK. The number of payrolled (PAYE) employees here in the UK is also trending lower, both in overall numbers but also the growth rate which has been falling since it peaked in March 2022.
- The number of unemployed people per vacancy is rising as unemployment rises and employers cut back on hiring. In the UK, the number of vacancies has dropped below pre-pandemic levels.
There are signs of sustained weakness in labour markets. Indications that the jobs market is weakening because of a slowing economy and one in which higher levels of uncertainty are deploying caution on companies’ willingness to hire new staff. Whilst this is an understandable reaction, should there be more evidence that the pace of weakness in the jobs market increases, central banks will need to respond quicker than currently anticipated to bring interest rates down.
Watchlist 2: Deficit
The trajectory of government deficits is concerning, but deficits very much remain the order of the day as governments struggle to constrain spending whilst needing to fund an expansion to areas such as defence and energy independence. In particular, there is increasing focus being turned to the size of the deficit and what this potentially means for the US bond market.
The US borrows almost $2tn annually and has debt servicing costs of $1tn. To put that in perspective, that is well in excess of the US defence budget. Whilst the US deficit ballooned during the Covid years, politicians from both sides have found deficit financing an increasing temptation. From the turn of this millenium, when the budget was in surplus, outside of the global financial crisis and COVID, the US has tended to have a deficit in, or around, 3% of GDP. In recent years however, the deficit has been creeping up to 5, then 6 and now almost 7%.
So why the concern now? The current budget reconciliation bill heading to the Senate seeks to extend existing tax cuts that were implemented in the first Trump Presidency that were due to end shortly. It also offers further tax cuts. The crux of the issue is that, if implemented, this essentially cements a super-high deficit through the course of this Presidency, at a time when foreign investors appetite for US assets is being questioned.
So, things to be watchful of:
Yields rising (or not falling as much as expected),
Poor uptake at a US bond auction (this means the US government failing to tempt enough investors to buy the debt being issued),
Signs of foreign holders of bonds not rolling maturing proceeds into new issues and for this to be picking up pace.
Watchlist 3: Tariffs – what next?
All options remain on the table and there is considerable uncertainty on what future tariff policy will emerge.
There are cases in Court challenging the President’s ability to impose some of the tariffs under specific pieces of legislation, but even if this is lost, the judgement won’t come before July 9th when the bulk of the 90 day pause ends. There are also other legislative paths the President can take to implement tariffs, if that route is legally blocked. The legal challenge is not on all the tariffs either, and some tariffs are already in place (steel, aluminium and cars for example). Clear as mud isn’t it!
The US wants tariffs to bring in revenue to fund tax cuts, so there will be tariffs. When the 90 day pause comes into effect, despite the potential for a flurry of deals beforehand, as in the UK agreement, if there are deals done they may not be there to reverse the full tariff burden. China/US have agreed to bring tariffs down from the excesses that they both announced in the immediate aftermath of Liberation Day, but suffice to say, we’re in a period where the goalposts keep moving.
US consumers have yet to feel the full impact on tariffs and the real-world consequences have not yet materialised in the inflation numbers. Research from JPMorgan suggest the effective tariff rate is around 14%, which is impactful and will push inflation higher in the second half of the year, well above the Fed target rate and bond yields have moved higher as a result. The potential tariff revenue raised is estimated to be in the region of $400bn, so whilst near-term there will be higher inflation in the US, long-term, there may be a reluctance to unwind this new revenue flow.
Growth and Inflation Numbers:
Thanks, as ever, to our friends at Schroders for the latest consensus forecasts, which are as at 15th May 2025:
GDP (%) 2025 | GDP (%) 2026 | CPI (%) 2025 | CPI (%) 2026 | |
| Global Economy | 2.6 | 2.5 | 2.6 | 2.4 |
| China | 4.5 | 4.1 | 0.6 | 1.1 |
| Emerging Markets | 3.8 | 3.7 | 3.0 | 2.7 |
| US | 2.2 | 2.0 | 2.7 | 2.6 |
| EU | 0.9 | 1.2 | 2.1 | 1.9 |
| UK | 1.1 | 1.3 | 2.8 | 2.4 |
Source: Schroders Economic & Strategy Viewpoint, Q2 2025 (Data to 15.05.2025)
Consensus forecasts made when the growth and inflation outlook are being built on the shifting sands of a US tariff policy are probably best served with a pinch of salt.
Nonetheless, the consensus has shifted lower for global growth. There is a slightly nuanced picture to paint though with lower growth in the US, both this year and next, China lower this year, but stronger next, and both Europe and the UK broadly static.
On inflation, in the US it is forecast to be noticeably higher this year on the presumption tariffs push prices higher, but this will be a one-off impact, China continues to struggle with the threat of deflation, Europe is broadly the same, whilst the UK sees slightly higher inflation this year as a result of energy prices.
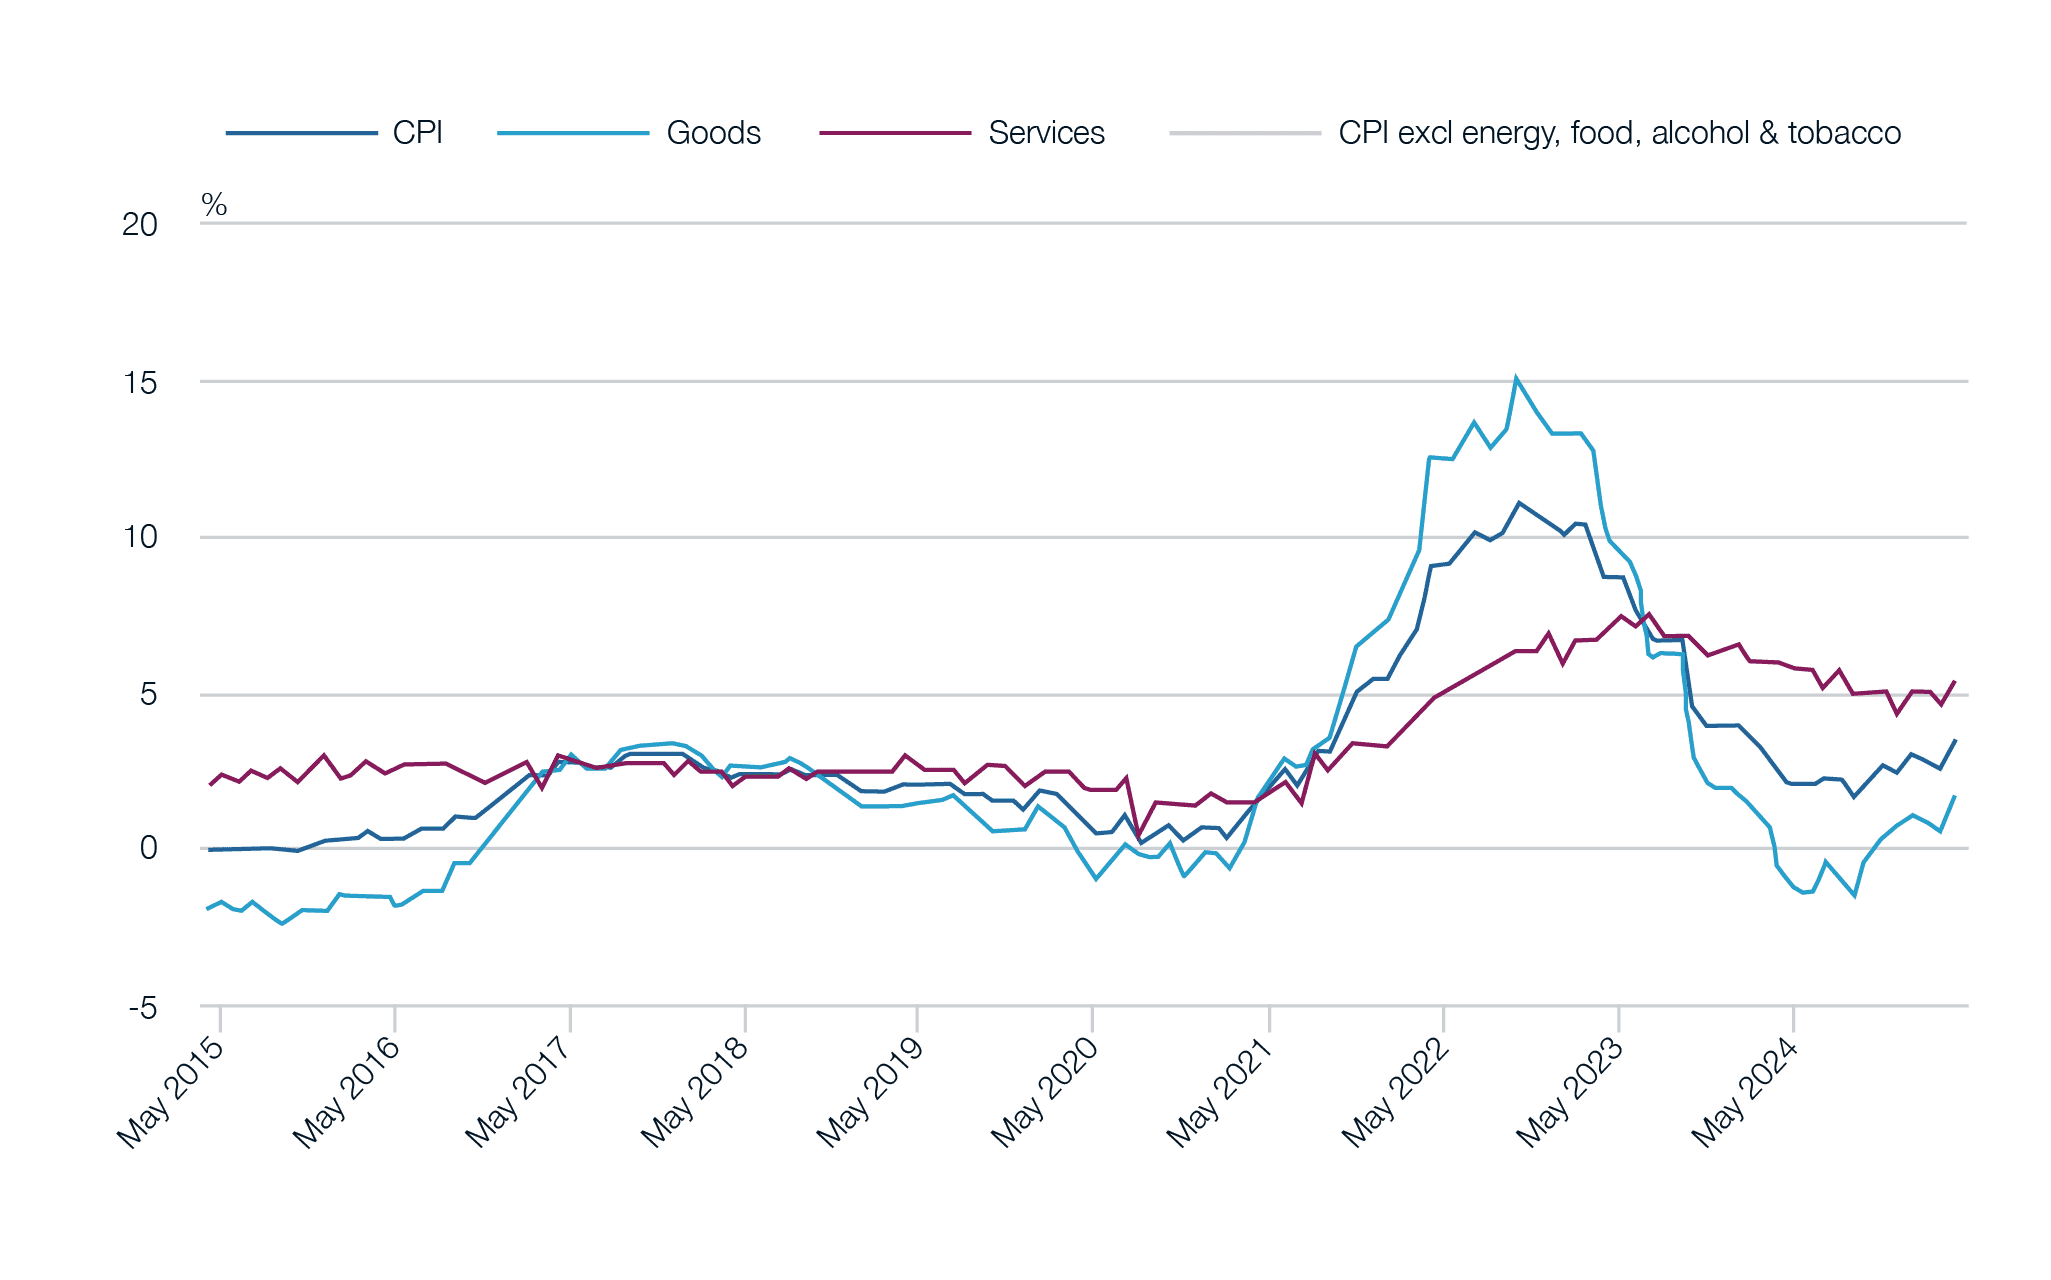
As for the UK, slightly embarrassingly, the Office for National Statistics had to admit to an error in calculating its April inflation number, which surprised to the upside by coming in at 3.5%, “blowing past forecasters’ expectations of a 3.3% rise”, according to The Economist. Suitably chastened, the ONS apologised and dutifully corrected by 0.1%. The culprit? Vehicle Excise Duty.
Despite the rise in inflation, much is to do with annual increases in energy, mobile phone and hefty jumps in water bills. Without resorting to any “that’s money down the drain” jokes, these are not drivers of the type of worrisome inflation that the Bank of England will be concerning itself with. Indeed, the expectation is for inflation to remain stubborn, partly as the pressure is coming from companies seeking to push through labour cost increases. The Bank of England will be watching both the increase in employer national insurance that begun in April as well as increases in the National Living Wage, which went up by 6.7% for over 21 year olds and 16.3% for 18-20 year olds. These both combine to increase the cost of labour – most impactfully in those lower paid roles, such as in leisure and hospitality, which reside in the dominant services part of the inflation picture – and why the pizza in your local pizza restaurant is pushing £20, but £3 in your supermarket.
Portfolio Outlook
Fixed income yields remain attractive, and increasingly the level of yield available looks like the primary driver of returns. This is a bit of a strange statement to make, given the starting yield in fixed income has typically always been the primary driver of returns from the asset class. Less common, but certainly a welcome bonus, is the impact on bond prices should market interest rates fall, as in this environment there are capital gains to be had as the market re-prices.
Bond prices change based on the return an investor would get by holding the bond until it matures. When overall market interest rates go down—mainly, but not only, because of expectations for central bank rate changes—existing bond prices usually go up. This happens so that the return (or yield) on older bonds matches the return on new bonds being issued, which offer lower interest payments (called coupons) because of the lower interest rates in the market.
The opposite is true when rates are falling, which is why bond prices fell so heavily during 2022 when interest rates rose rapidly in the wake of rising energy prices following the Russian invasion of Ukraine, which happened when inflation was already elevated as a result of the reawakening global economy following COVID, as demand of goods and services soared at a time of supply constraint.
Whereas a few months ago, the expectation of falling bond yields was driven by the thinking that, as economies slowed and as inflation quietened, the pathway for central banks to cut rates and for fixed income yields to fall as a result, was relatively straightforward. This opened the opportunity for fixed income to contribute to portfolio returns, not only because of income at levels largely unseen for the bulk of the last 15 years, but also because there was an expectation that lower interest rates would push up bond prices as a result.
As time moves on, thinking needs to evolve too. What happens if central banks do take interest rates lower, but market bond yields don’t follow? There are reasons to think why this may be the case. A bond is a loan after all, and anyone providing the loan will alter the level in interest being charged depending on the degree of expectation that the loan will be fully repaid. ‘Rock solid’ guarantees of repayment see the lowest level of interest, lower quality results in a higher interest rate.
If you break the economic world into three constituent parts, firstly, the government, second, corporations, and third households, it is governments who have typically enjoyed the ‘rock solid’ status, no more so than the United States which benefits from an independent central bank, the rule of law, as well as the US dollar as the world’s reserve currency.
However, the level of government debt today is much higher than it has been for decades. This higher debt burden has arisen primarily out of two crises. First, in the huge stimulus put in place as the global financial system teetered on the brink of collapse during the global financial crisis. This saw government debt as a percentage of GDP rise strongly as a result and an extended period of low interest rates, which assisted both households and corporate balance sheets to enter a lengthy period of repair. At the onset of the COVID pandemic in 2020, it was only the government third of this triad that had not begun to recover, and it was from this position of relative weakness that government debt burdens extended even further, as support packages for health systems and economies were put in place. This is placing a strain on governments, not just because of the limited amount of leeway governments have to raise more debt, but also through the high amounts of interest payments – as mentioned, the US alone pays $1 trillion per year on servicing its government debt burden.
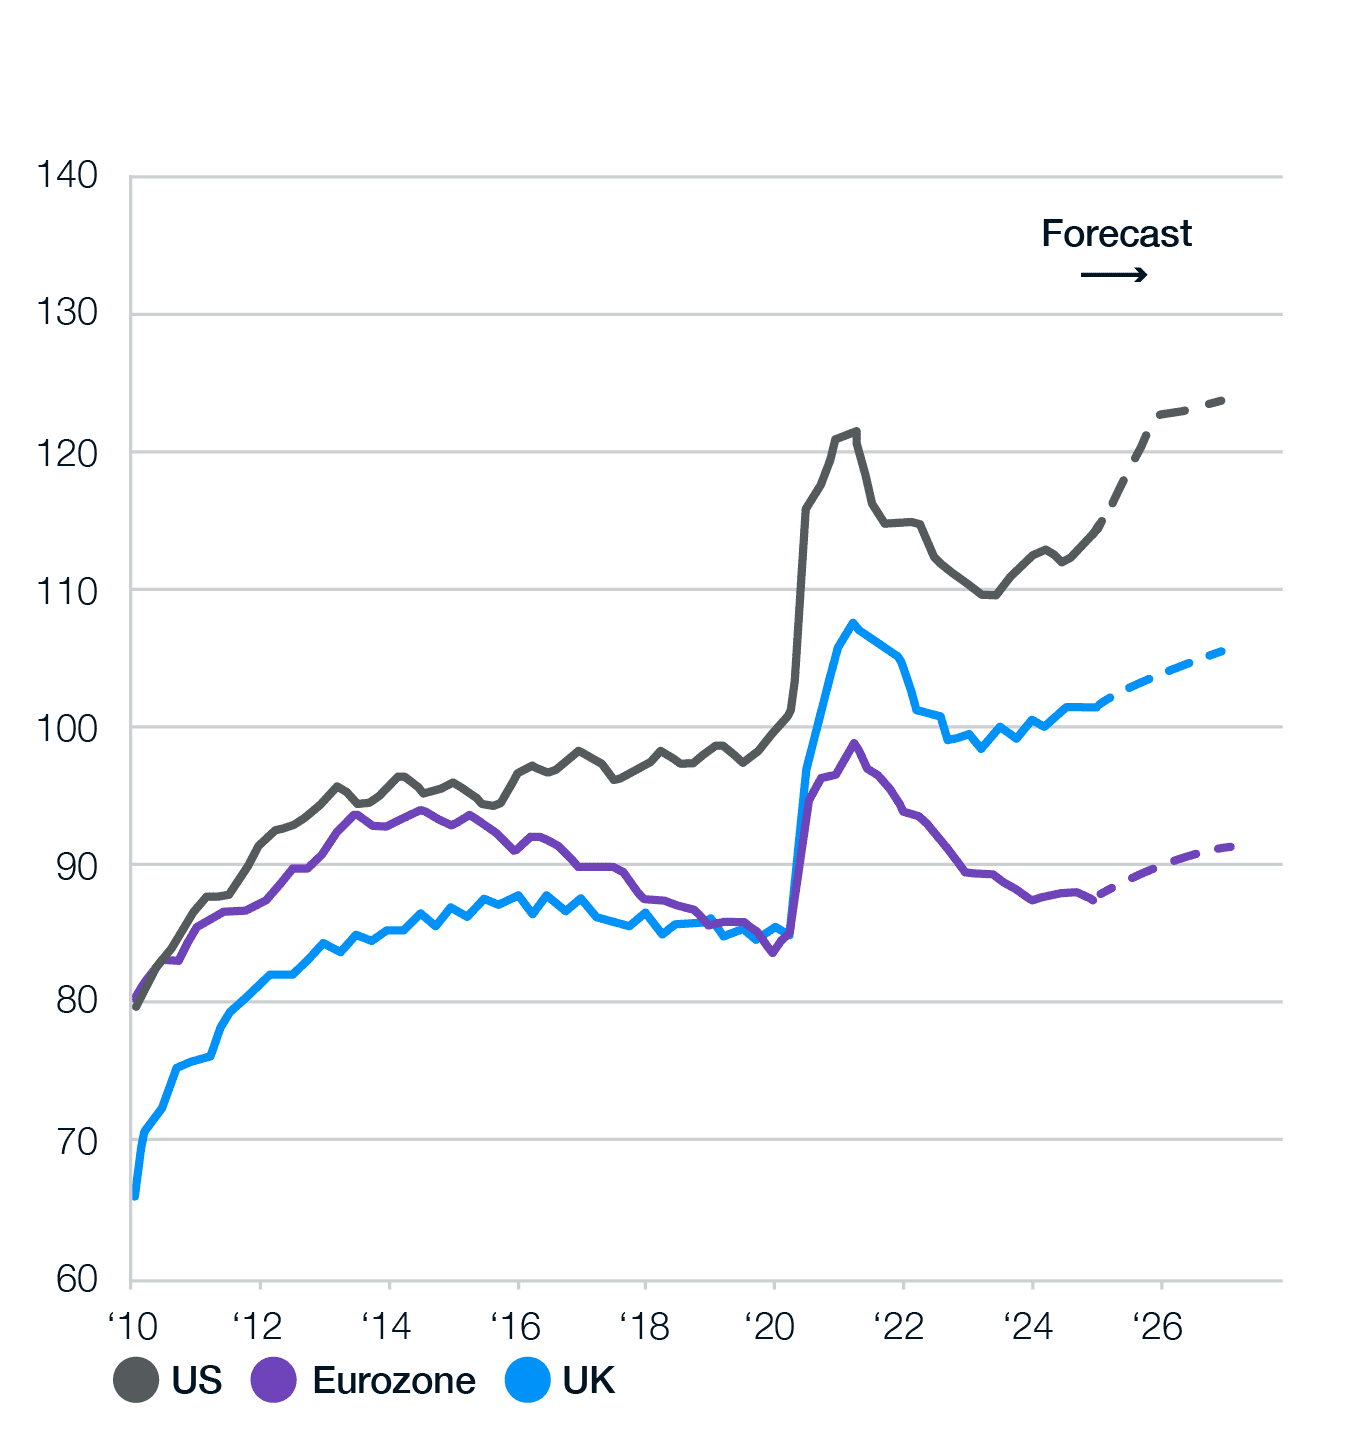
Source: J.P. Morgan Asset Management, Guide to the Markets.
It has been quite some quarter for global equity markets. April turned sour quickly with tariff threats dragging down markets in short order, making April one in which volatility reigned, but ultimately recovery came through as the biggest excess of the tariff storm abated.
There was a brief moment when market valuations dropped, but with their recovery, we return broadly to where we were, which is with equity markets are divided. There remain sectors, such as mega-cap US tech, that contain highly successful, cash-generating businesses, but their valuations have gone back to where they were at the beginning of the year, which is in the ‘expensive’ bracket. Other sectors, and indeed equity markets outside the US, offer more value but still lack a catalyst to unlock it. Over the long-term, it makes sense to hold a measure of both, hence our policy of having well diversified portfolios and not trying to time mean-reversion in markets.
We made several changes to the Core, Passive and Positive Impact Portfolios while remaining mindful of the current macroeconomic environment. These changes are designed to reflect our long-term asset allocation views, streamline portfolios, while maintaining strong diversification across asset classes, geographies, and investment styles. Broadly, we want to ensure that our strategic asset allocation is reflected as closely as possible across all model portfolio ranges, whilst recognising there will always be a level of variation given the different mandates.
We can’t cover every single change here, but broadly:
In Core portfolios, we removed Janus Henderson Strategic Bond and Vanguard US Government Bond as well as trimming other holdings. This was to begin new positions in L&G Strategic Bond and a new absolute return fund, PM Tellworth UK Select. We also added to Fidelity Index UK Gilt.
In Passive Portfolios, we sold Vanguard US Government Bond, typically reinvesting in Fidelity Index UK Gilt, given yield levels in the UK look attractive and given concerns around US government deficit levels. We also altered the equity geographical weightings with the overall intention of decreasing US equity, to diversify into other geographies. In lower risk/reward portfolios, we also topped up L&G Global Infrastructure Index.
In Positive Impact Portfolios, we removed several funds which were underperforming, such as JOHCM Regnan Global Equity Impact Solutions and FP WHEB Sustainability. We also sold some funds where we had identified better options, bringing in CCLA Better World Global Equity and BNY Mellon Responsible Horizons Strategic Bond. One area of difference between Positive Impact Portfolios and Core and Passive ones has been the limited amount of government bond exposure, given the limited options available. We completed research in this area and have added EdenTree Global Sustainable Government Bond to portfolios.
Conclusion: You don’t need to be a sailor to know how to tie a rope, sorry
As Linda from ‘The Traitors’ proclaimed, some things are just so obvious that there is no explaining necessary. As much as we look forward to Celebrity Traitors with both anticipation (mostly for Claudia’s one-liners), but also with some trepidation (will adding a host of well-known celebrities somehow lose some of its relatability and authenticity?), there’s no hiding from some of life’s bigger questions.
Unfortunately, there are no obvious, easy answers when it comes to markets, which means this is not a moment to try and play hero. “Steady as she goes” and “tough-sledging” are all appropriate!
Fixed income assets look well positioned to take back their rightful role in portfolios. Namely, delivering steady income and defensive ballast to the inevitable buffeting equity markets go through each and every year. There’s both a danger that central banks don’t cut interest rates as fast as we had hoped, but also the possibility that economies slow faster than expected, in which case central banks continue to hold firepower to bring rates down faster than planned.
Meanwhile, equity markets are divided. Certain segments feature highly successful, cash-generating businesses with expensive valuations, while others offer clear value but still lack a catalyst to unlock it. Over the long-term, it makes sense to hold a measure of both, hence our policy of having well diversified portfolios and not trying to time mean-reversion in markets.
For portfolio returns, this is likely to be another year of trekking through heavy mud and back to the good ol’ days of Glastonbury in the early 1990’s!
During the quarter, we became responsible for over £1bn of client assets as we crossed this milestone in our 15th year of discretionary portfolio management. Whilst this is significant for us, our chief focus and energy remains building portfolios for you, so that you have the financial foundation to achieve your goals and aspirations. This commentary does though give me the opportunity to say a very sincere thank you. As ever, from all of us in the investment team, Will, Emma, Becky, Kim, Hayley and me, we thank you for continuing to place your trust with us in managing your portfolio and we wish you all a wonderful summer (and for those facing exam results come August, the very best of luck!).